A Payrolls Report that Matters Again
Tomorrow’s Employment Report offers something it hasn’t offered in a very long time: the chance to actually influence the course of monetary policy, and therefore markets.
Now that the taper has started, its continuation and/or acceleration is very “data dependent.” While many members of the FOMC are expecting for the taper to be completely finished by the middle of this year (according to the minutes released yesterday), investors understand that view is contingent on continued growth and improvement. This is the first Payrolls number in a very long time that could plausibly influence ones’ view of the likely near-term course of policy.
I don’t think that, in general, investors should pay much attention to this report in December or in January. There is far too much noise, and the seasonal adjustments are much larger than the net underlying change in jobs. Accordingly, your opinion of whether the number is “high” or “low” is really an opinion about whether the seasonal adjustment factors were “low” or “high.” Yes, there is a science to this but what we also know from science is that the rejection of a null hypothesis gets very difficult as the standard deviation around the supposed mean increases. And, for this number and next months’ number, the standard deviation is very high.
That will not prevent markets from trading on the basis of whatever number is reported by the BLS tomorrow. Especially in fixed-income, a figure away from consensus (197k on Payrolls, 7.0% on the Unemployment Rate will likely provoke a big trade. On a strong figure, especially coupled with a decline in the Unemployment Rate below 7%, you can expect bonds to take an absolute hiding. And, although it’s less clear with equities because of the lingering positive momentum from December, I’d expect the same for stocks – a strong number implies the possibility of a quicker taper, less liquidity, and for some investors that will be sufficient sign that it’s time to head for the hills.
I think a “weak” number will help fixed-income, and probably quite a lot, but I am less sure how positive it will be for the equity market.
In any event, welcome back to volatility.
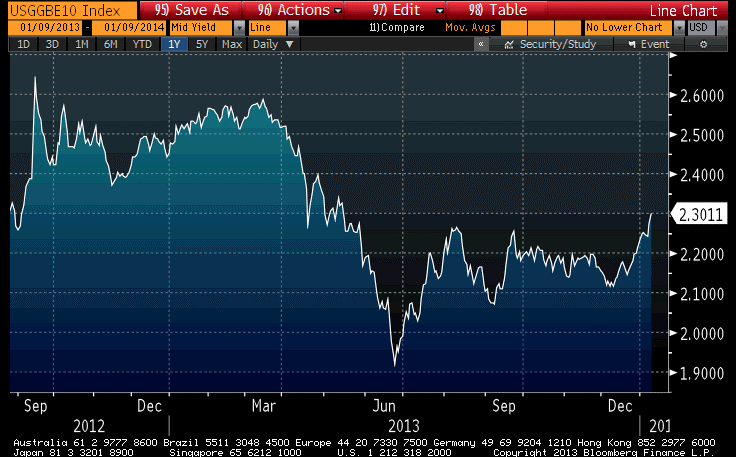
Meanwhile, with commodities in full flight, inflation breakevens are shooting higher. Some of this is merely seasonal – over the last 10 years, January has easily been the best month for breakevens with increases in the 10-year breakeven in 7 of the 10 years with an overall average gain of 15bps – and some of it is due to the reduction of bad carry as December and January roll away, making TIPS relatively more attractive. Ten-year breakevens have risen about 18bps over the last month, which is not inconsistent with the size of those two effects. Still, as the chart below (Source: Bloomberg) shows, 10-year breakevens are back to the highest level since before the summer shellacking.
 Indeed, according to a private metric we follow, TIPS are now back almost to fair value (they only very rarely get absolutely rich) compared to nominal bonds. This means that the benefit from being long breakevens at this level solely consists of the value that comes from the market’s mis-evaluating the likelihood of increasing inflation rather than decreasing inflation – that is, a speculation – and no longer gets a “following wind” from the fact that TIPS themselves were cheap outright. I still prefer TIPS to nominal Treasuries, but that’s because I think inflation metrics will increase from here and, along with those metrics, interest in inflation products will recover and push breakevens higher again.
http://www.clevelandfed.org/research/trends/2014/0114/01labmar.cfm
Of course, I know what your response will be: that wages don’t lead inflation, they follow it, but I thought you’d be interested in seeing this anyway since it comes from the Fed.
on the contrary, this stuff is useful. Not for inflation, but for trying to understand where corporate profits are headed. Because when the compensation pendulum swings towards the employee, it swings away from the capitalist and implies lower profit growth. I think this is going to be a big story over the next few years and that’s why you’ll see margins compress!
________________________________
Unless “comprehensive immigration reform” passes and we see another another amnesty, plus massive increases in legal immigration at all skill levels as in the Senate immigration bill passed last year. This legislation is a classic case of capital versus labor, although most of the “labor” in this country does not appear to realize what’s at stake (note that capital, as represented by the US Chamber of Commerce, most certainly does).
Hi Michael Given our recent discussion on “profits” I was surprised to see you reverting to “conventional wisdom” on profits.. That is, higher wages get spent for the most part and become corporate revenues – leaving profits relatively unchanged. As you know, changes in wagers do not enter into the “profit equation”. .
Charles – I am still struggling with the difference between ‘revenues’ and ‘profits’ I guess! Wages become (mostly) revenues, but that doesn’t imply that they are profits – wage growth and profit margins tend to be inverses – check out this picture, which shows the “Kalecki Profits” series versus the Y/Y change in Avg Hourly Earnings: http://mikeashton.files.wordpress.com/2014/01/kaleckearns.gif?w=483 If you do it as a scatterplot (wages as a function of profits) you get a slope of -0.35 and an r^2 of 0.47 (which is exaggerated by the overlapping nature of the series, but not bad because these are quarterly): http://mikeashton.wordpress.com/?attachment_id=3262
I don’t think these are inconsistent (indeed, the charts would suggest otherwise). If household savings decline because earnings growth has been weak, that would imply greater Kalecki profits, wouldn’t it?
Michael thanks for taking the trouble with the nice graph. We can never be sure about causality. For example, the wage growth tends to positively correlate with higher real economic growth which then causes lower deficits and lower profit margins. But there are a lot of moving parts and I agree with your point as your graph and calculations are certainly suggestive.
My “basic” understanding of Kalecki and wages is that higher wages mean higher corporate costs. If all of these wages are spent, however, then corporate revenues go up by an equivalent amount, leaving profits unchanged. However, maybe everything can be reconciled by the idea that less than 100% of higher wages are spent. Thus, revenues go up less than costs and therefore higher wages result in moderately lower profits.
Also it occurred to me that if evenn if wages and revenues go up together with profits unchanged, profit margins (as opposed to profits) still decline. That is, if wages, revenues, GDP are all increasing and profits are unchanged, then profits as a % of GDP fall a bit. So that would be another way of reconciling Kalecki with your graph’s implication. Thanks.
Charles – Both really good points! Thanks for that. This is really useful back-and-forth for me.
________________________________